Published on: 06 June 2019
Last Updated on: 13 September 2024
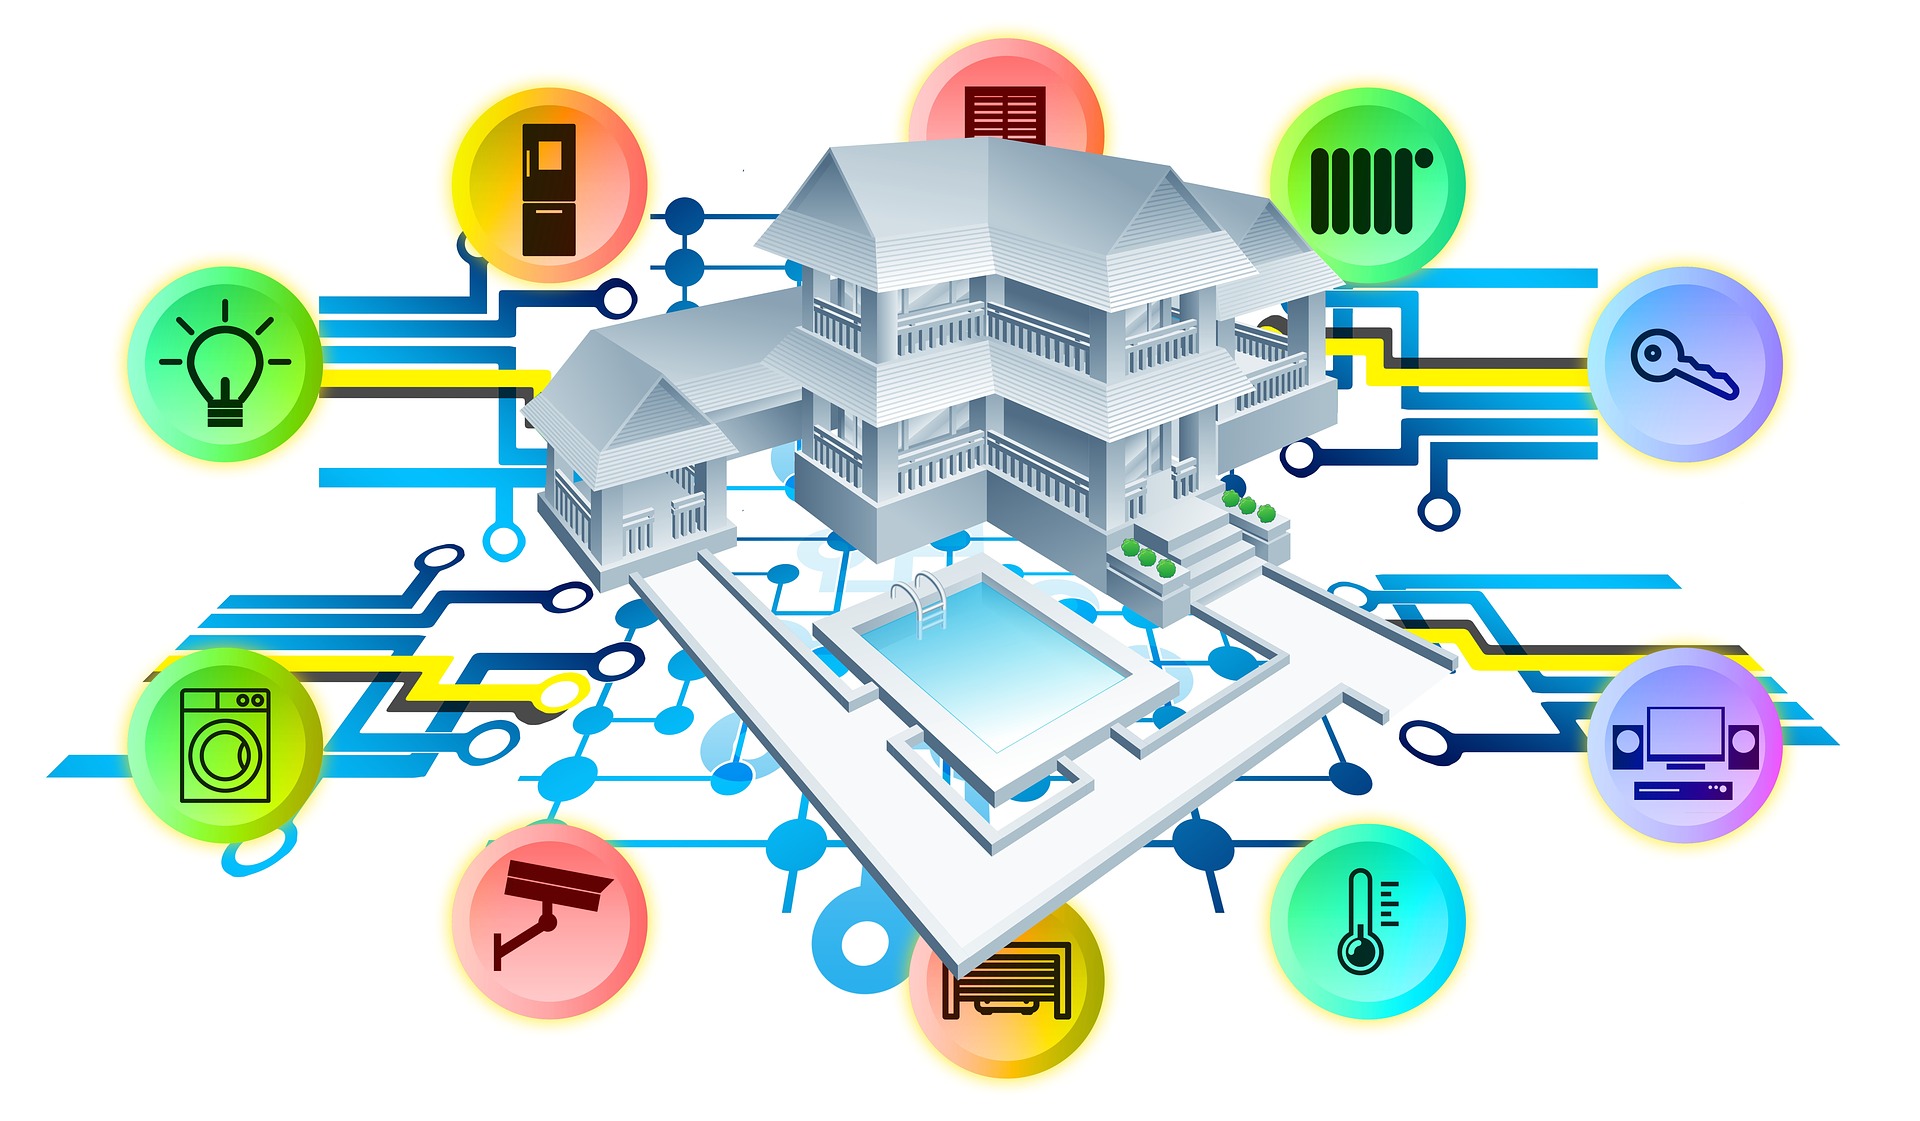
From smart locks to futuristic thermostats, modern homes are living up to their name more every day. But these technologies aren’t just convenient and innovative. Though they do make life easier, they can also put a huge dent in your utility bills and help you consume less energy at home. This is possible with a smart thermostat, for example, which monitors your lifestyle habits (i.e., when the house is empty or when everyone turns in for the night) and makes temperature changes to optimize your energy use.
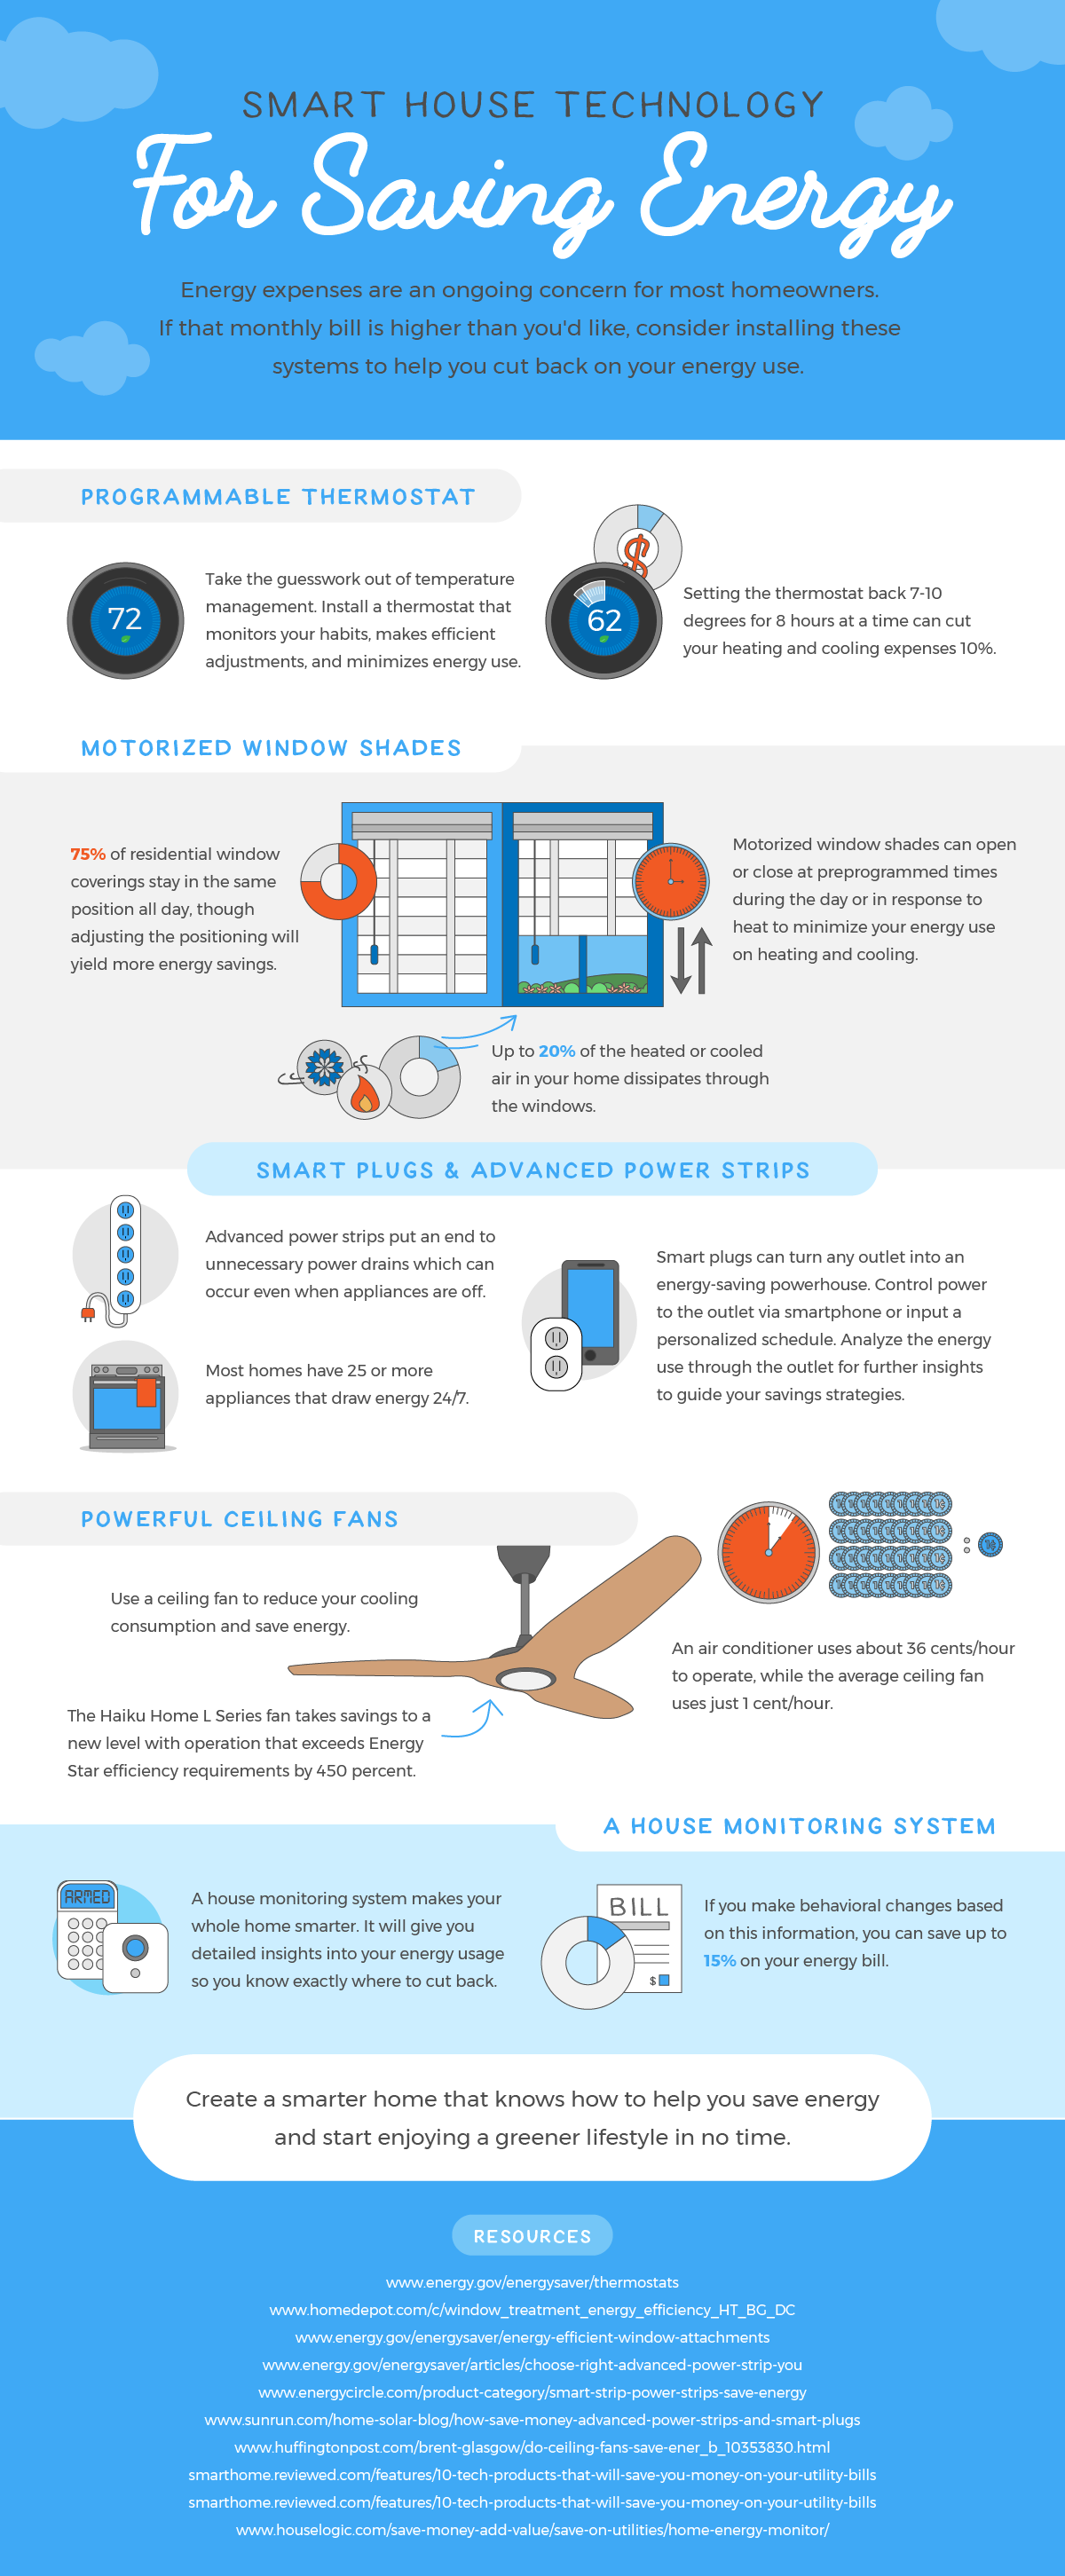
Smart House Technology for Saving Energy:
Adjusting your thermostat by 7-10 degrees for eight hours can make a significant difference in your energy consumption, and smart technology makes it easy to do so without having to compromise your family’s comfort at home. The device will simply make the temperature change when everyone is at work or school, for example. A similar but less talked about innovation is motorized window shades. These open and close at peak times throughout the day to help heat and cool your home naturally. These and other energy-saving smart technologies are outlined in greater detail in the infographic below.
Modern technologies are certainly eye-catching, but plenty of less thrilling appliances, such as efficient stoves and dishwashers, are also being innovated to consume less energy. A professionally installed new HVAC system, for instance, will keep you comfortable while lowering your utility bills. This will ensure you can cool off and warm up with a quality system while also integrating energy-saving technologies and practices at home — all without compromising your comfort.
Content Rally wrapped around an online publication where you can publish your own intellectuals. It is a publishing platform designed to make great stories by content creators. This is your era, your place to be online. So come forward share your views, thoughts and ideas via Content Rally.
Vision board is not a new thing but its popularity is. Famous celebrities like Oprah, Ellen Degeneres, Lucinda Cross and so many more have shared their experience how a vision board helped them achieve their dreams. But just creating a vision board cannot give you your desired results. You will have to consciously make efforts to let it work towards its purpose.
Before we get into that, let’s see what a Vision Board is and the principle it works on
Vision Board :
Simply put, a vision board is a visual representation of your goals and dreams. It can be about anything but it serves one purpose: motivating you. You can add in anything you like, pictures, quotes, poetry, art, anything that reminds you of your dream or goal and helps you keep a positive attitude. You can make it as big as you want.
The Principle Behind It
Vision board works on what is called the law of attraction. How it works is that when you see things related to your goals, you visualize them in your mind. Once you visualize them, our mind is focused on them and with a focused mind, we attract them. The law of attraction says whatever you think, you attract. A vision board helps you channelize your thoughts towards your goals by showing you things related to them. You can even get a law of attraction App to help you use this law better.
How To Get The Best Out Of Your Vision Board :
1. Keep It Where You Can See It :
A lot of work on a vision board depends on whether you see it regularly or not and how many times. So you have to keep your vision board somewhere you can see it without making any effort. You can put it on your study table or on your wall against your bed. Any place where you spend a lot of time every day or visit too frequently is a good place for a vision board.
2. Work On Its Visual Aesthetics :
Anything that appeals to our visual aesthetics, we tend to pleasantly see it more. So try to make a vision board that seems pretty to you. Add things that you like. You can use cut-outs from magazines or print pictures you found online or even create something yourself. Visually appealing boards will also help you put more thought into what represents your dreams better. This, in turn, will help you get your thoughts straightened out.
3. Add your Reminders Or To-Do List :
If you make it a habit to add your reminders and daily to-do lists on your vision board, you will have an extra reason to see it, again and again, every day. The more you see your vision board, the better you’ll be able to visualize your goals and be motivated to work towards them. Subconsciously, your mind will be more focused on doing things that take you closer to your visualization.
4. Download A Vision Board App :
Although a physical vision board is great in itself, you can increase the influence by downloading a vision board app. It’s difficult to include all your goals in one vision board and not always possible to create multiple physical vision boards. A perfect solution is a digital vision board. They’re easy to make and take half as much efforts. You can create dedicated vision boards for each of your goals or sort them out in categories and make one for each of them. Moreover, a vision board app will help you have 24*7 access to your vision board so that you can see them more frequently.
Invest Time In Updating It :
Your goals and aspirations keep changing. Either something is added onto the list or something is omitted. Then why should your vision board be the same? Take some time out and update your vision board. This goes for both physical as well as digital vision boards. This will ensure you spend time on thinking about your new aims and polish them. You can include your short-term goals to the board as well.
Vision boards take time in creating and maintaining. But this is a good investment since it’s essentially a focus building and visualizing exercise. Your mind needs the training to visualize things correctly and regular exercise for the same is necessary to get the results you want. If you have no prior experience with vision boards and you’re not too sure about it, download a vision board app and start with a digital vision board. A little discipline and committed efforts can help you change your entire thought process.
Read Also :
How Easy Is It Hiring A Story Board Artist?
The applications of data in various fields are becoming more relevant than ever. From sports to music, the applications of data and technology are finding new uses, applications, and results. If you have seen the Brad Pitt baseball movie, ‘Moneyball’, you would know exactly what I am talking about.
Many argue that the applications of big data cannot apply to creative fields like music or writing. However, experts who are getting big data analytics certification think otherwise. Books, people point out cannot be judged according to big data. In other words, whether a specific book will become successful is a creative function that is dependent on experience, expertise, and audience reception.
Not quite so! It appears that scientists and data practitioners have come up with a method to analyze and understand whether a book can become a best-seller or not.
How does the Big Data Algorithm work?
In the last few years, experts like Jodie Archer and Matthew Jockers have analyzed the last 30 years of New York Times bestsellers. They have then applied scientifically and tech-developed algorithms to look at various trends, patterns, and learnings to figure out what is common in all these books. The results are striking.
Bestseller-Ometer, the algorithm has data fed into it from more than 20000 books and novels. For publishers, this comes as a welcome advancement. They do not need to take a risk call on every manuscript that passes through their doors.
They can easily just run the software and figure out which novel is going to work and which is not going to sell. If you are looking at percentages of success, the makers are confident of 80%! That is a huge percentage to take into consideration at any given point in time.
Is this a Reality that is going to change the Publishing World forever?
To be honest, the application of the data is not the first in terms of the idea. This was first assessed and put into work in the jewelry industry. Inkitt, a German-based start-up was the first to look at the various inputs and reading perceptions of the readers and come up with an algorithm that assesses what is liked and what is not.
The algorithm takes into account, the following factors-
What is the rate of repetition of the pages that the readers go over?
How long do they dwell on a specific section?
Are there any thematic points that are considered more?
Where are the books purchased and read from?
Once all these inputs are fed into the software, the algorithm runs its course and gives out suggestions, and shows definite patterns.
The Human Factor- Can this be Completely Discounted?
Both Jockers and Archer feel that even though the algorithm is great, it is not 100% thanks to the human factor. You might ask what is this factor?
This factor is called the human intimacy factor. It refers to the emotional and intimate bond that forms between a book’s characters and the reader. Think about Harry Potter novels and how they have become a household name for everyone of this generation.
It also means that new genres, one that has still not been discovered are subject to the human emotional connection and chance. An algorithm can only assess data that is in front of it.
If there is something completely new and unique, the algorithm will not be able to give a cohesive reading of the same. In such cases, editors need to depend on their experience to understand whether the said work can be successful or not.
The Bottom Line:
Big data analytics is changing the creative and arts industry in a major way. As more research and developments take place, it is only a matter of time before we see more full-proof connections emerge in this industry.
Read Also:
YouTubNow: An Honest Review in 2021
CustomEssayOrder – Custom Writing Service Review
Want an Amazing Photobook? Choose Mixbook
The global pandemic of 2020 was challenging for frontline workers, the public, and businesses. Besides a dwindling economy, governments and organizations suffered various setbacks, including exponential data thefts. Security incidents became more costly and harder to contain for the latter due to a drastic operational shift. As per experts, the cost of a data breach reached a record high, shelling $4.24 million per incident on average from affected ventures.
As more businesses migrate to the digital world, data security becomes a reason for severe migraine for owners. Keeping the incidents and the present situation in mind, the European Union introduced the General Data Protection Regulation (GDPR) for improved data privacy controls for EU citizens. GDPR requires a thorough evaluation of every software application before its implementation to prevent possible data breaches and loss of customers, employees, and corporate data. Automatically, business process management solutions, like process mining, RPA, automated process discovery, and others, fall under the tight scrutiny of GDPR data privacy guidelines.
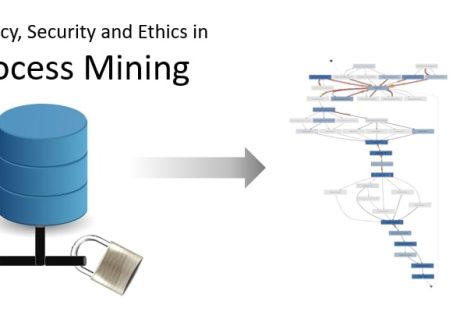
Process Mining in Business Process Management – A Brief Overview
Process mining is an intelligent technology solution enabling owners to build a reliable visual map of business processes elaborating how every task within a process is executed. It captures employee-software system interactions and converts data into event logs. This provides an overview of end-to-end processes.
Process mining tools provide task and process insights to evaluate task executions for scaling improvement opportunities. These insights also support informed decision-making pertaining to process efficiencies and complexities.
Process mining bridges the gap between traditional model-based processes and data-centric processes for further analysis. There are three basic types of process mining; namely, process discovery to discover a process model capturing the behavior in an event log (collection of events), conformance checking for identifying commonalities and discrepancies between a process model and an event log, and process re-engineering to improve a process model using event logs. In a human-centric process, each event comprises a case identifier, an activity name, a timestamp, and optional attributes such as resources or costs. Usually, a case identifier refers to individuals and includes much personal data. And herein lies the significance of improving data security.
The Importance of Data Security in Process Mining
Automated process mining relies heavily on enterprise data and captures confidential information about the company or the clients. Data collected during the mining of processes are categorized under the following datasets:
Key identifiers: These datasets contain unique information identifying individuals, such as their full names and social security numbers.
Quasi-identifiers: These datasets are considered indirect identification of individuals—for example, gender, age, and postal code.
Sensitive attributes: Information related to salary, payment, financial statements, and others are private and sensitive for individuals or companies.
Insensitive attributes: These datasets contain general or non-risky information not covered by the other features.
Given the confidential and sensitive nature of the above-mentioned data, attention to cybersecurity in process mining has gained momentum recently. Also, third parties can offer the latter; therefore, choosing providers with secure products and processes is equally crucial. Any breach in data security can prove costly for the company owners and tarnish customer/client/partner relationships.
But the shared responsibility of protecting critical information should rest upon employees. After all, it is said that the usual source of security incidents are current employees and, in certain instances, ex-workers.
Respective teams, while handling information, should protect sensitive data at every step of task execution. In order to achieve the same, decisions regarding data transparency and usage should be made aforehand. Most specifically, such decisions involve the type of data used, data extraction methods, data accessibility, data protection, and compliance requirements.
On the other hand, process mining can be leveraged to detect silent internal attacks on data. It can quickly identify abnormal behavior in the company’s internal network and indicate apparent security breaches.
Therefore, data is integral to process mining, and the security of which should be the core objective of software applications and associated teams.
Key Privacy Metrics in Process Mining
In order to evaluate the privacy of specific data, owners should decide on particular metrics for measurement. These privacy metrics tally the security level of each data in terms of disclosure and are broadly categorized under the following sub-heads:
Bounded knowledge: Data is restricted with specific rules to avoid disclosing confidential information.
Need to know: The unnecessary data is eliminated from the system to prevent any breach. This metric controls data access.
Protected from disclosure: Data confidentiality is observed during data mining using the classification method.
Data quality metrics: These metrics measure the loss of information/benefit, while the complexity criteria validate the efficiency and scalability of different techniques within this scope.
Process Mining and Data Capture – Key Points to Consider
Since process mining extracts granular data at the process level, care is taken to ensure that any new process doesn’t come into conflict with personal data policies. Owners should also ascertain that software solutions for mining processes comply with the specific data security requirements. Therefore, people involved with the entire system must consider a few data capture points.
Access to raw data: The process mining team requires access to corporate data to understand what’s most important for analysis. Here, the company can choose and grant access to specific datasets for further research.
Choose the right strategy: Besides mining processes for raw insights, the team also translates the raw data into broad terms and updates it into dashboards. Later on, the respective team can decide what features to focus on.
Filter: Occasionally, the company tracks information that doesn’t require further analysis for specific processes. In this case, the data can simply be omitted from the system. Datasets that are sensitive or do not directly impact the business analysis outcome are deleted to maintain the focus only on valid and relevant data.
Pseudonymization: Encrypting the information to protect the confidentiality of sensitive information prevents users from correlating them to real data specific, like specific names, addresses, or other PII data. For instance, if the company wishes to maintain secrecy about employees directly involved with process-related tasks can follow this approach. Here, the case identifier’s name is replaced with numbers.
Anonymization: This is similar to pseudonymization, where the names are replaced with unique pseudonyms instead of numbers. Hence, unauthorized users cannot identify individuals’ names or confidential information about them from the available data.
Conclusion
Besides handling data in bulk daily, enterprises using online systems leave behind their digital footprints. These footprints are valuable data captured by process mining to examine how employees execute each process and sub-tasks. Needless to say, mining for such insights is done with the company’s best interests in mind, namely, to optimize operations and resources and derive maximum value.
However, such datasets carry sensitive information of various interested parties, any breach of which can prove highly hazardous for all. Therefore, data is the primary source for process miners to carry out their objectives, but the company must ensure the data is handled with care. Hence, data security is a significant factor in process mining.
Have A Look :-
How to Get Copy of a Divorce Decree
7 Secrets To Make Your Baby Fall Asleep Faster
All That You Need To Keep In Mind Before Selling On Facebook