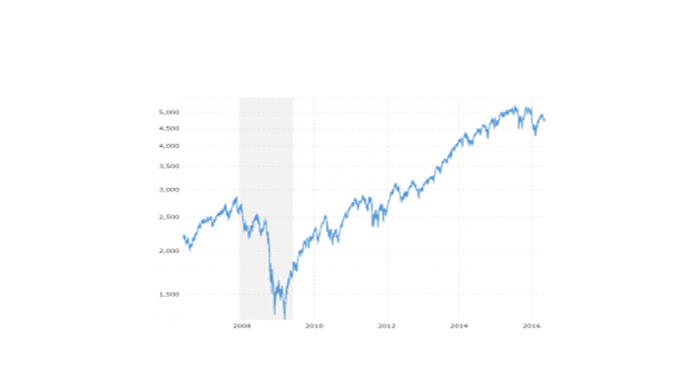
Dow Jones Stock Market Chart has made investment research easier and more comprehensive. The world of the stock market is quite enticing and, inspired by the movies or a real-life story, most of you must have thought of investing in stocks. Eventually, people give up the idea and continue watching the movie or reading the newspaper. The most common reason behind the dropping of the idea of investments is – people generally think of investments as a really complicated matter, which is completely untrue. Investments are not complicated but they need a bit of practice and you have to be good with numbers.
Various Stock Market charts like Dow Jones Stock Market Chart, have made investments a lot easier. Now, stock market indexes have made the trend analysis more numeric than imaginative. So you have a number to trust on, rather than your instincts or other such unreliable figures. One of the most popular and most used stock market indexes is – Dow Jones Industrial Average or DJIA. Securities Research can help you benefit from your stock investment.
DJIA is a collective price-weighted index that uses the share prices of its 30 component companies to weigh the fluctuations in the US Economy. Dow Jones Stock Market Chart is one of the oldest stock market index and is still is one of the most used indexes, in spite of various criticisms. So, let us understand this stock market chart by knowing various facts about it.
Here are 7 things to know about Dow Jones Stock Market Chart
1. The Component Companies:
Currently, DJIA takes into account its 30 component companies. This includes the current business-leaders of the US economy like – Apple, Microsoft, AT&T, Boeing, etc. DJIA, in its beginning, has only 12 component companies mainly from the industrial sector.
2. The History:
DJIA was coined in 1896 by Charles Dow and Edward Jones for providing a proxy for the broader US economy. DJIA was weighted arithmetic mean at the beginning, which means, it was just the arithmetic mean of the share prices of individual stocks of its component companies.
3. It is a Price-Weighted Index:
DJIA is a price-weighted index. This means – more the share price of a stock of a component company, greater will be its weight. The resultant sum is then divided by The Dow Divisor rather than the number of contributing stocks. Thus the next point of interest is – The Dow Divisor.
4. The Dow Divisor:
The Dow Divisor came onto the scene to avoid the minor changes like split-dividends, spin-offs, or such others. This ensures that the final value of DJIA and the Dow Jones Stock Market Chart doesn’t get affected by these minimal changes.
5. Trend Analysis:
The Dow Jones Stock Market Chart has been a reliable source for the trend analysis of the stock market. It can also be used to study the falls and spikes in the share prices of individual stocks of a certain company.
6. Reading Dow Jones Stock Market Chart:
Dow Jones Stock Market Chart is really helpful but the most important thing is to know how to read them. Reading these stock market charts takes a lot of practice and experience. Securities Research has more than 80 years of experience in the field of investment research. Use our experience to benefit from your investment. Learn to read DJIA Charts with Securities Research; download your free eBook now!
7. Components keep changing:
The contributing companies of DJIA keep changing according to the change in the leadership in business trends. One of the grandest replacements in DJIA was Apple replacing AT&T to get in the 30 companies of DJIA on April 18, 2015.
Read Also :


