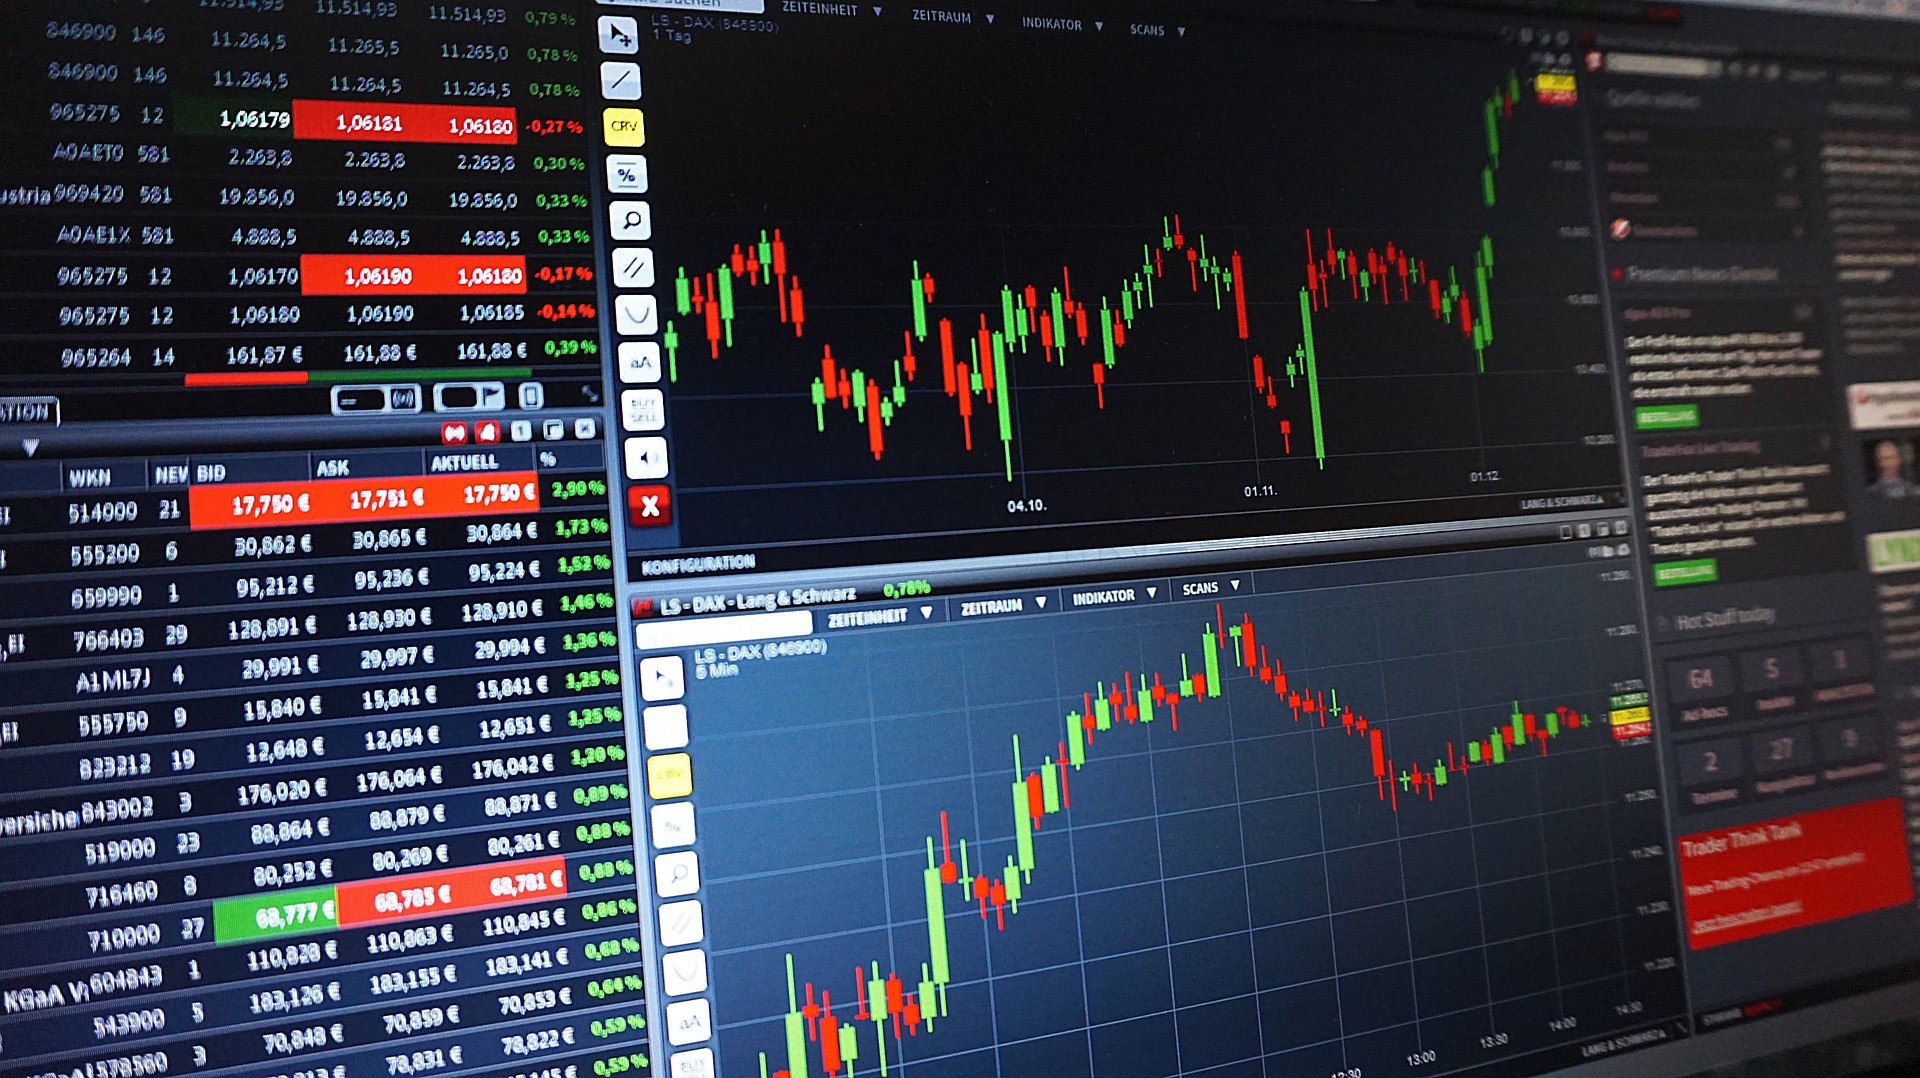
Every online trader knows that reading a candlestick chart is just part of their skillset. Without it, you won’t be able to glean all the information you need about the market in mere seconds. And while other charts offer a lot of data about stocks, trends, and market movement, candlestick charts are quite popular thanks to their ability to condense a lot of information in their structure and the way the body, color, and shape of the candlesticks are represented on the chart. To help you get up to speed with this important concept here’s a breakdown of candlestick charts as well as a guide to doji candlestick pattern.
Unique Candlesticks:
Shaped like a candle, data on the chart are represented by a candlestick shape called the body. That body could be hollow or filled each denoting a different piece of information. There’s also the long thin line above and below the body. They are called “shadows” and refer to the high and low ranges of the price. The top shadow represents the high end of the price while the bottom one is for the low range. A hollow body represents a stock that closes higher than its opening price. In that case, the top shadow refers to the closing price while the bottom shadow represents the opening price. On the other hand, a stock closing lower than its opening price is represented as a filled body with the bottom shadow depicting the closing price while the opening price is represented by the top shadow. Thus it is easier to interpret the candlestick charts compared to other charts and learn more about the market trading with just one look.
Bodies Long and Short:
When you look at the chart and see a long body you can tell right away that there’s a lot of trading on that stock. The opposite is true of short bodies where little price movement is involved. Whether the body is black or white also tells you more about the kind of pressure the stock went through. A long white body means the buying pressure was extreme. They refer to a bullish wave and you should take a closer look at the big picture to make a good decision regarding this stock. Along black body is the exact opposite. It means the opening price declined and selling is rather aggressive. It’s not a good sign for that stock and you might see a panic in the market.
Shadows Long and Short:
Since the shadows represent the highs and lows of the session, there’s a lot you can tell about the session by just observing those top and bottom shadows. Short shadows mean that the majority of the trading was restrained and within the opening and closing prices. Long shadows, on the other hand, mean that prices swung wildly going beyond the open and close. So if you see a long upper shadow and a short bottom one you can conclude that buying was aggressive of this stock with high bid prices but later the highs were tampered leading to a weak close. The same can be read from a short upper shadow and a long bottom one. Selling was dominating the trading of this stock but toward the end of the session buyers forced the prices up giving it a good close.
Doji Pattern:
Doji is another candlestick that represents neutral patterns. However as part of the big picture they can provide a lot of information. You need to take into account the preceding price and future confirmation in order to decide whether the doji points to a bullish trend or a bearish one. A doji means the open and close of the security were equal. But both the previous trend and following candlesticks can change that neutrality. A long white candlestick followed by a doji can mean the buying pressure is easing off. The same applies to a long black candlestick followed by a doji. It means the selling is not as aggressive as before and there won’t be a panic. In general, doji mean the market is stable and both the supply and demand are even around that security.
Candlestick charts are a valuable way to get a lot of information about the trading of a certain stock. It’s a valuable asset in your trading arsenal and will help you become a more successful trader.
Read Also:


